
Pop culture, in my experience, seems to define God very differently from how the Bible depicts Him. What do you think? Is this diagram fairly accurate?
Graph made with the help of GraphJam FlashBuilder.
Pop culture, in my experience, seems to define God very differently from how the Bible depicts Him. What do you think? Is this diagram fairly accurate?
Graph made with the help of GraphJam FlashBuilder.

(This is how it usually ends up for me–did I hit the nail on the head? LOL)
Graph made with the help of GraphJam FlashBuilder.
This is just from my personal observation while using the Internet…did I hit the nail on the head?


Note: I don’t run my sites for any profit, and I realize sites that are designed for profit have to make money…but sometimes all the “attention-grabbing” text gets a little much for the average Internet user, you know? 🙂

Admittedly, I’m not much of a fashion maven, but I’ve done enough shopping and worn enough clothes in my life…enough to create the above infographic based on my personal observation of fashion pricing. There are pros and cons to buying fashion of all price ranges, but I have personally found that you CAN achieve the best of both worlds by carefully choosing well-made, mid-priced clothing. They land right in the “Fashion Goldilocks Zone” (not too cheap, not too costly; not too trendy nor too basic, etc), described in the graphic above.
Sure, mid-priced clothes are not designer clothes, but they’re also not likely to fall to pieces when you wash them a few times, either (as I have unfortunately experienced). If you’re willing to look for slightly higher-quality clothing that is put together well, especially for clothes you’ll be washing and wearing a lot, you’ll actually SAVE money in the long run because you won’t have to replace your whole wardrobe every year. (You don’t have to buy the most expensive clothes to have the best quality, either, because I’ve also unfortunately found that sometimes the high-priced pieces wear out just as quick as the cheap stuff.)
More help on picking quality clothing for less money:
Six Secrets to Spotting High-Quality Clothes
Accessible Chic: 6 Places to Shop Quality Clothes Online
How to Buy Nice Clothes On the Cheap
Is Buying Expensive Clothing Worth It?
How to Spot Quality Clothing
This chart is about as accurate as I could muster! I’ve been told many things about my sense of humor (i.e., that it doesn’t exist, or that I don’t laugh at things that are “clearly funny”), but as you’ll see, the “funny” side is just as filled out as the “non-funny” side! Check out the things that will make me wrinkle my brow with disgust, as well as the things that will have me making uncontrollable squeaky laughs of belly destruction. 😀
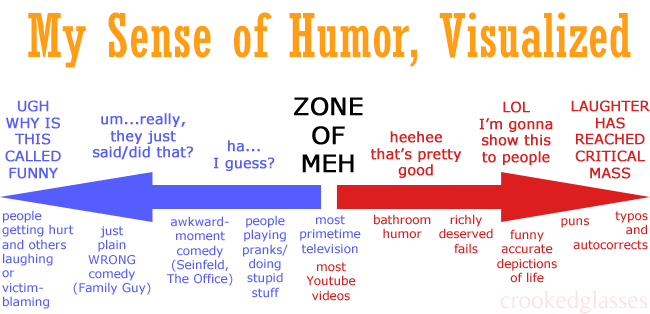
(And yes, I am well aware that the non-funny side includes very popular comedy styles/shows, but hey, everyone’s got an opinion :D)
As webdesigners, we have to make our sites both informative and beautiful to view. This takes a careful balance of design ideas, which need to be constantly upgraded and improved as users’ needs change.
Thus, the reason I came up with the following graphic depicting the considerations that go into making good webdesign decisions. I call this a “cycle” because we webdesigners never completely stop reevaluating our own decisions–we’re always coming up with ways to do it better, whatever “it” is!


This is why I watch a whole lot of PBS these days…anybody with me?
Graphs made with the help of GraphJam Builder.